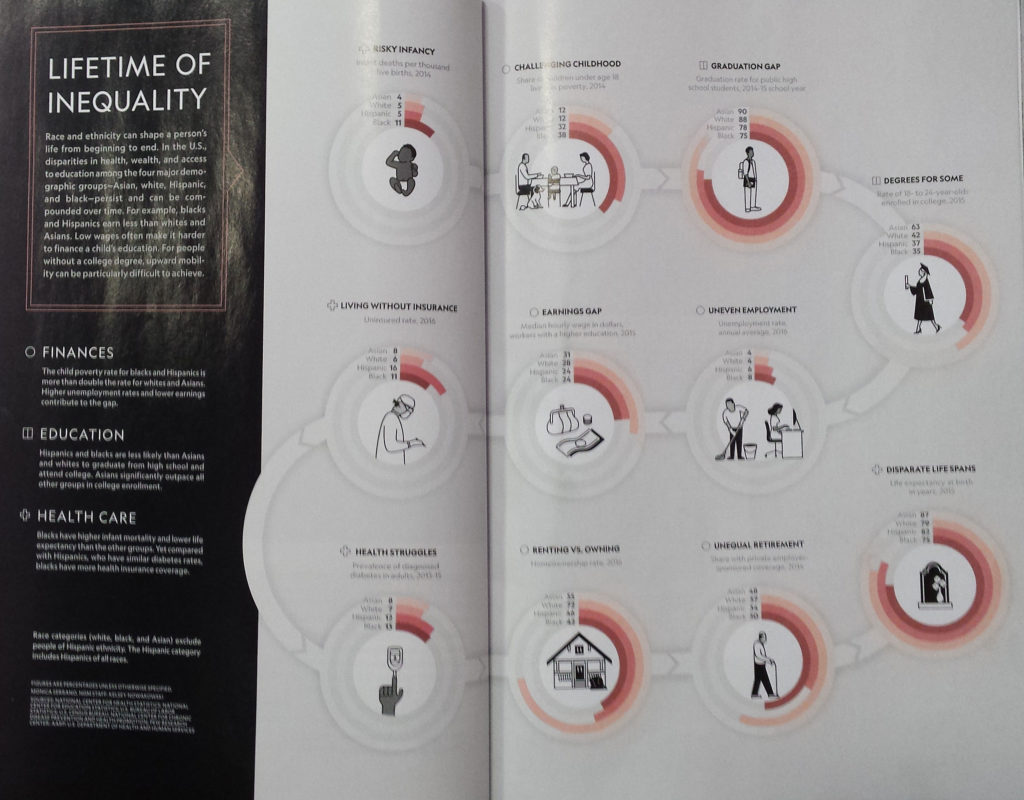
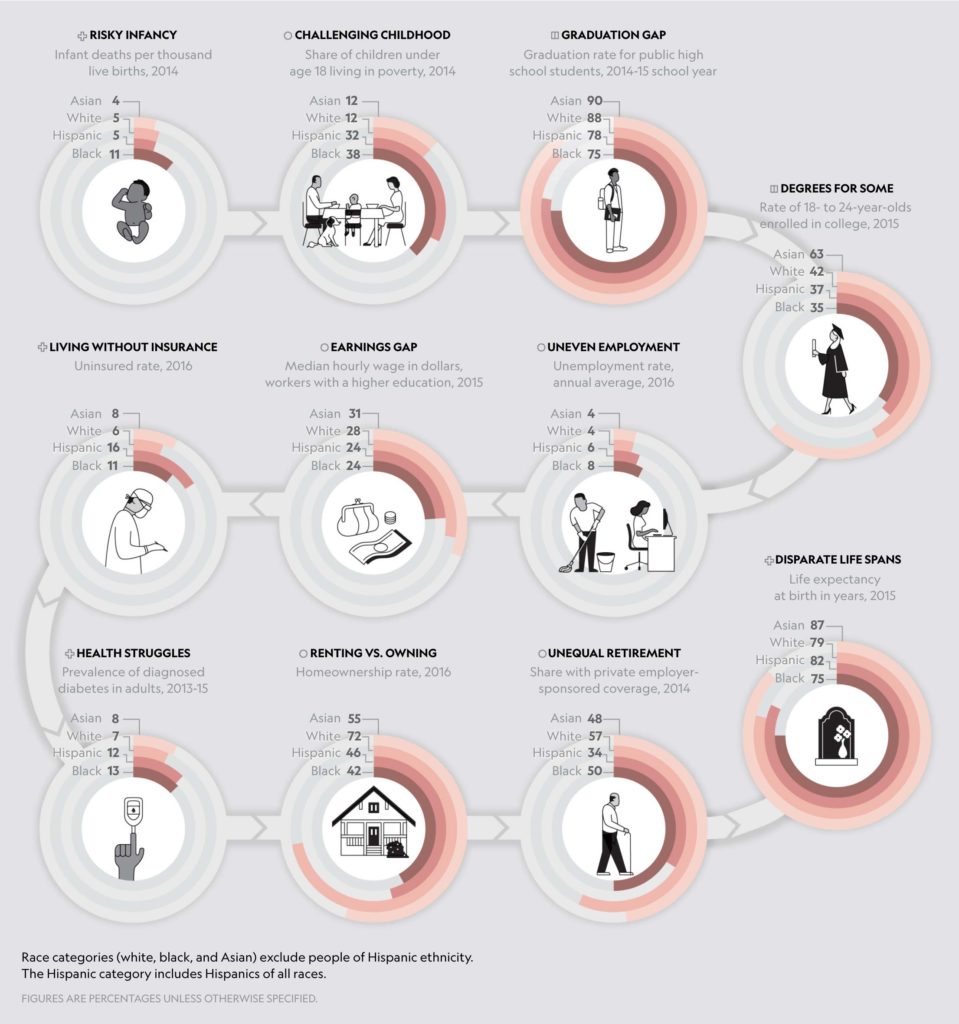
Students will design an infographic poster at 11 x 17 or 12 x 18 inches. This poster will require you to collect information and organize it in a way that is visually powerful and appealing.
Your poster shall present at least three groups of the information data.
All imagery used must be your own illustration. No photographic imagery.
You will be required to show your process through:
Research and ideation
Collection of imagery and data
Typography
Typographic studies will be part of your research and design process. Document your studies.
Color studies
Problem Statement
You must inform your audience about a subject that interests you or you feel strongly about. (Pick who your audience is based on the topic.)
Find or collect data that teaches, informs, and/or shocks and portray that data visually. Data visualization is only as good as its data.
Don’t recreate a chart that could be made with Microsoft Excel, nor should you rely TOO much on typography to convey your message.
Show, don’t tell.
Goals
Your poster will be graded based on the appropriateness of the data, how that data is portrayed, and how easily it can be understood.
People who want above average grades should include more than one layer of meaning as well as avoid unnecessary imagery and details. I will also be looking at your use of grids, good color combination, and good typography.
Your poster should need very little to no need for explanation. Your information should be clearly laid out and easily found, labels need to be meaningful, data should not be slanted or skewed by bias or misleading imagery, and your method or idea for portraying data set should add to the ease of understanding.
Constraints/requirements
- Poster: 11 x 17 or 12 x 18 inches, 4/0 CMYK inks, Bleeds okay
- You should have an intro paragraph unless you can prove that people will understand your poster without it.
- All sources must be cited on the poster.
- All imagery must be appropriate and true to the data
- You are not allowed to use imagery that you don’t legally have the right to use.
Design Process
1. Problem identification and definition (design brief)
2. Research and discovery
3. Competitive analysis
4. Visualize, explore, and ideate
5. Compose, evaluate, refine
6. Execute or implement
Deliverables
1. Pinterest Process Board
2. One Mounted Poster
Due: Tuesday, April 7th (at the beginning of the class)
Resources on data finding and data visualization
Global No. 1 Business Data Platform – Statista
Find Data & Statistics: Best Places to Start
Data Visualization. Learn about best practices and tools to visualize data using charts and maps.
Grading
Concept Development/Process: 40%
- Research on infographic poster (5), Research and data gathering on the topic (5), Analysis of problem-competitive analysis and design brief (10), Quality/clarity of sketches (10), Design development & roughs(10)
Execution: 40%
-
Clarity of message (10), Concept/creativity(10), Visual organization(10), Content/Data (10)
Presentation/Craft (process board & final)- 20%
Total: 100 points


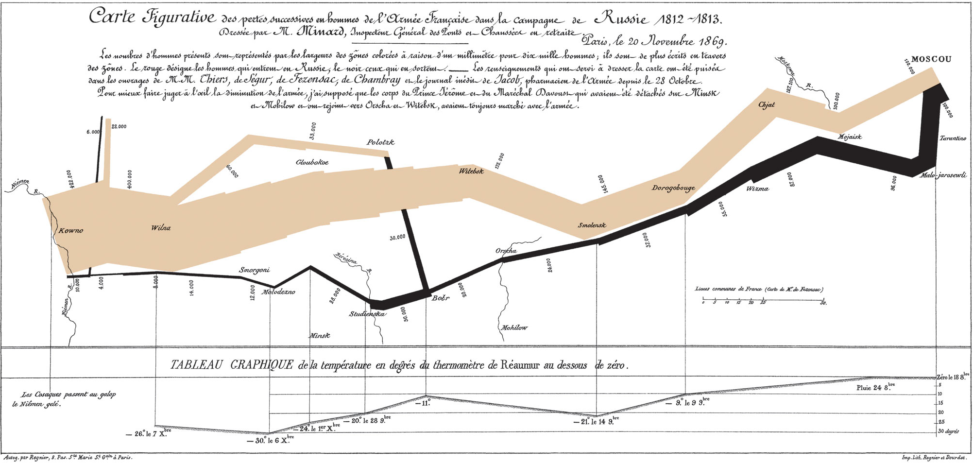
* The Minard Map by Charles Joseph Minard, 1869
Presenting the number of men in Napoleon’s 1812 Russian campaign army, their movements, as well as the temperature they encountered on the return path
